本文代码基本都参考自 joyful_pandas

赛题及要求

task 1

基本代码

1
2
3
4
5
6
7
8
9
10
11
12
13
14
15
16
17
18
19
20
21
# 1. 导入需要用到的相关库
# 导入 pandas 库,用于数据处理和分析
import pandas as pd
# 导入 numpy 库,用于科学计算和多维数组操作
import numpy as np

# 2. 读取训练集和测试集,返回DataFrame对象
# 使用 read_csv() 函数从文件中读取训练集数据,文件名为 'train.csv'
train = pd.read_csv('train.csv')
# 使用 read_csv() 函数从文件中读取测试集数据,文件名为 'test.csv'
test = pd.read_csv('test.csv')

# 3. 计算训练数据最近11-20单位时间内对应id的目标均值
# dt越小,离得越近。时间1-10指的是要验证的数据,11-20是用来计算的。
target_mean = train[train['dt']<=20].groupby(['id'])['target'].mean().reset_index()

# 4. 将target_mean作为测试集结果进行合并
test = test.merge(target_mean, on=['id'], how='left')

# 5. 保存结果文件到本地
test[['id','dt','target']].to_csv('submit.csv', index=None)

数据展示

1
2
3
4
5
6
7
8
9
10
11
12
13
14
15
16
17
>>> print(train[:5])
>>>
id dt type target
0 00037f39cf 11 2 44.050
1 00037f39cf 12 2 50.672
2 00037f39cf 13 2 39.042
3 00037f39cf 14 2 35.900
4 00037f39cf 15 2 53.888

>>> print(test[:5])
>>>
id dt type
0 00037f39cf 1 2
1 00037f39cf 2 2
2 00037f39cf 3 2
3 00037f39cf 4 2
4 00037f39cf 5 2

具体函数及语法

1. 索引

相应代码:train[train['dt']<=20]

train['dt']返回的是一个 series 数据类型,即 dt 这一列的数据(故没有column列名),并从中筛选出11-20天的数据 target ,最后又转换为 DataFrame 的格式。

1
2
3
4
5
6
7
8
>>> print(train['dt'][:5])
>>>
0 11
1 12
2 13
3 14
4 15
Name: dt, dtype: int64
1
2
3
4
5
6
7
8
>>> print((train['dt']<=20)[:5])
>>>
0 True
1 True
2 True
3 True
4 True
Name: dt, dtype: bool
1
2
3
4
5
6
7
8
>>> print(train[train['dt']<=20][:5])
>>>
id dt type target
0 00037f39cf 11 2 44.050
1 00037f39cf 12 2 50.672
2 00037f39cf 13 2 39.042
3 00037f39cf 14 2 35.900
4 00037f39cf 15 2 53.888

2. 分组

相应代码train[train['dt']<=20].groupby(['id'])['target'].mean()

原型df.groupby(分组依据)[数据来源].使用操作
表示的是将一个 id 下的所有 target 求平均。id代表一个具体的房子,它11-20天每天都有不同的电力消耗 target,对其求平均,最后的结果是每一行都是不同的 id 及其 target_mean。

可以看到,最后的结果是没有索引的!只有id,没有target的列名

1
2
3
4
5
6
7
8
9
10
>>> train_demo = train[train['dt']<=20]
>>> print(train_demo.groupby(['id'])['target'].mean()[:5])
>>>
id
00037f39cf 39.6543
00039a1517 49.1805
000c15d0ea 26.7723
00150bc11a 30.7137
0038d86077 10.7277
Name: target, dtype: float64

3. 重置索引

df.set_index()表示将某一列的数据都当作索引。可以加append=true保留原本的列索引。
df.reset_index(['id'], drop=true)即是 set 的逆函数,表示取消某一列索引,drop=true表示直接把这一列删除,不恢复到数据中。
df.reset_index() 表示重置所有索引,且生成一个默认的索引。

1
2
3
4
5
6
7
8
9
>>> target_mean = train[train['dt']<=20].groupby(['id'])['target'].mean().reset_index()
>>> print(target_mean[:5])
>>>
id target
0 00037f39cf 39.6543
1 00039a1517 49.1805
2 000c15d0ea 26.7723
3 00150bc11a 30.7137
4 0038d86077 10.7277

4. 合并 merge()

参数how
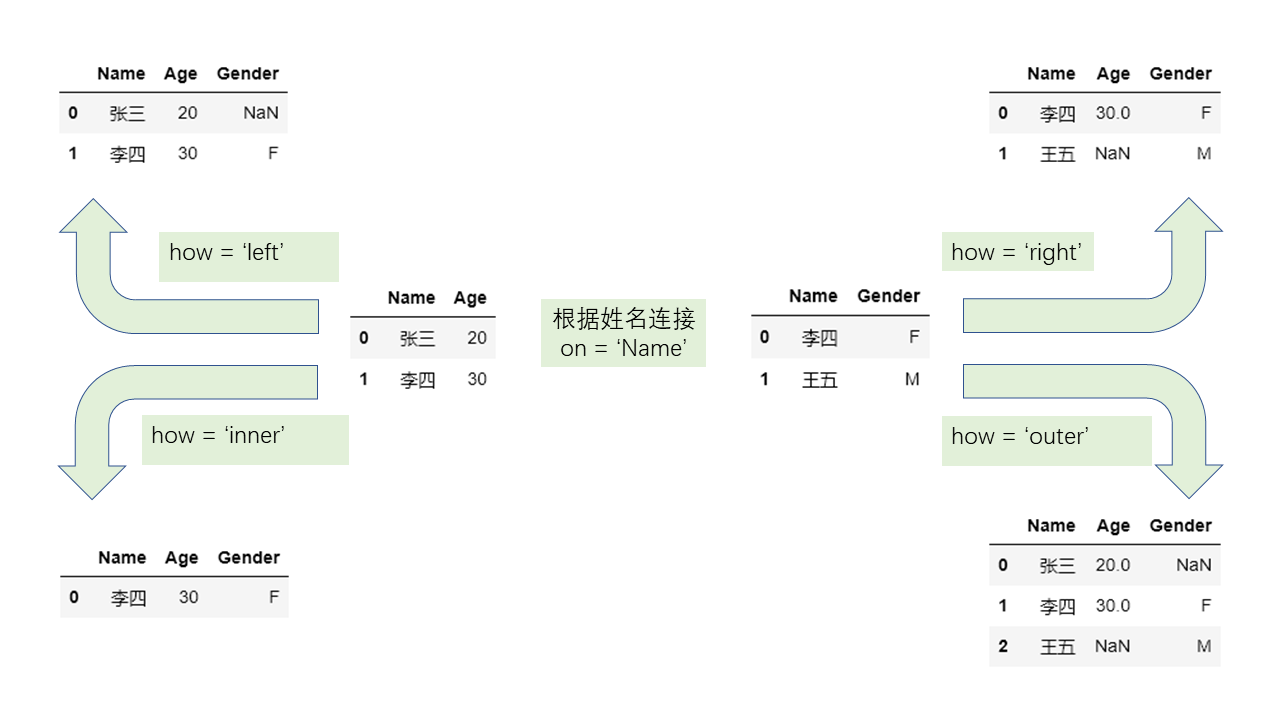
相应代码:test = test.merge(target_mean, on=['id'], how='left')

  • on=['id']表示按 id 这一列进行数据的合并。
  • how='left'表示只保存与 test 测试集有的 id 相关的数据。
  • 如果列的名字不相同,则还有left_on='',right_on=''的表示
1
2
3
4
5
6
7
8
>>> print(test[:5])
>>>
id dt type target
0 00037f39cf 1 2 39.6543
1 00037f39cf 2 2 39.6543
2 00037f39cf 3 2 39.6543
3 00037f39cf 4 2 39.6543
4 00037f39cf 5 2 39.6543

注意到,我们前十天每天预测的target是相同的,这也是我们task1的算法,即用11-20天消耗的平均值作为我们预测近10天的结果。

5. 保存

test[['id','dt','target']].to_csv('submit.csv', index=None)

  • 保存['id','dt','target']三列数据到文件 submit.csv。
  • index=None表示不保存索引,因为我们excel表格自带有索引。